Strategy to Execution

Workforce planning as a decision surface

Turn strategy into demand, test resource choices, see portfolio consequences and approve an executable workforce plan.

TalentJam helps leadership answer "What should we do?", not simply report "What do we have?"

Strategy→Demand→Supply→Scenarios→Portfolio→Approval→Execute
Explore Capability Intelligence Book a demonstration →

Strategy is easy to document. Execution is harder.

Most organisations can describe their strategy, define objectives, establish initiatives and create projects. The harder question is whether they can deliver all of it with the capability and capacity they have.

Can we actually deliver all of this with the capability and capacity we have?

Strategy and workforce information usually live in different systems. One tells you what the organisation needs to achieve. The other tells you what people, skills and resources it currently has.

Most workforce planning tools stop at reporting the second. TalentJam connects the two, and then helps leadership decide what to do about the difference.

Strategy
↓
OKRs
↓
Initiatives
↓
Projects and BAU
↓
Tasks
↓
Capability demand

Start with strategy, then progressively expose detail

Six questions, in order. Executives stay at the decision level; planners open the demand, capability and resource evidence underneath.

01
Strategy
What are we trying to achieve?
02
Demand
What work does that create?
03
Supply
What can we perform now?
04
Scenarios
What choices change the position?
05
Portfolio
How should scarce capacity be allocated?
06
Approval
What plan do we commit to?
Decision levelExecutives see position, change, implication and decision on one surface.
Progressive disclosurePlanners open the demand, capability and resource evidence behind each figure.
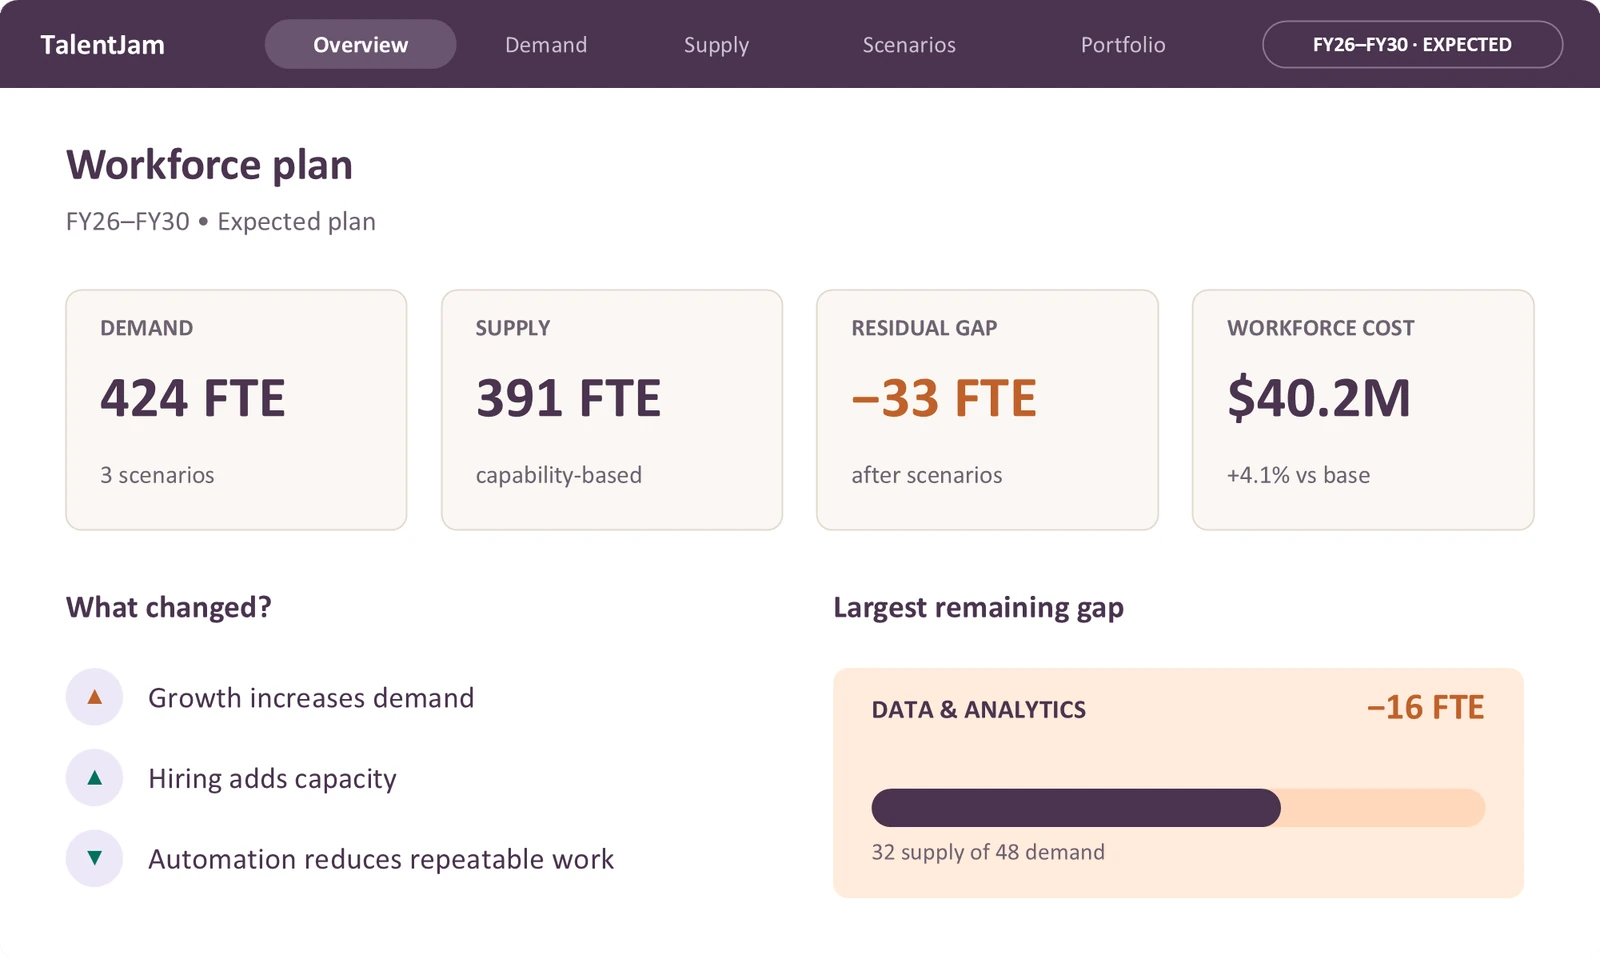
TalentJam executive overview: demand 424 FTE, supply 391 FTE, a residual gap of 33 FTE and $40.2M workforce cost, with what changed and the largest remaining gap

Executive overview: position, change, implication and decision on one surface. Illustrative example.

This isn't a dashboard. It is an information surface that supports leadership to make decisions.

The loop remains reversible until approval.
Make the work explicit

Demand is work to be performed at a required capability level, not simply a request for roles. Each component is explicit, so the portfolio can be optimised during planning.

Capability demandthe work, resolved
=
SkillWhat skill
+
ProficiencyWhat level
+
VolumeHow much
+
TimingWhen
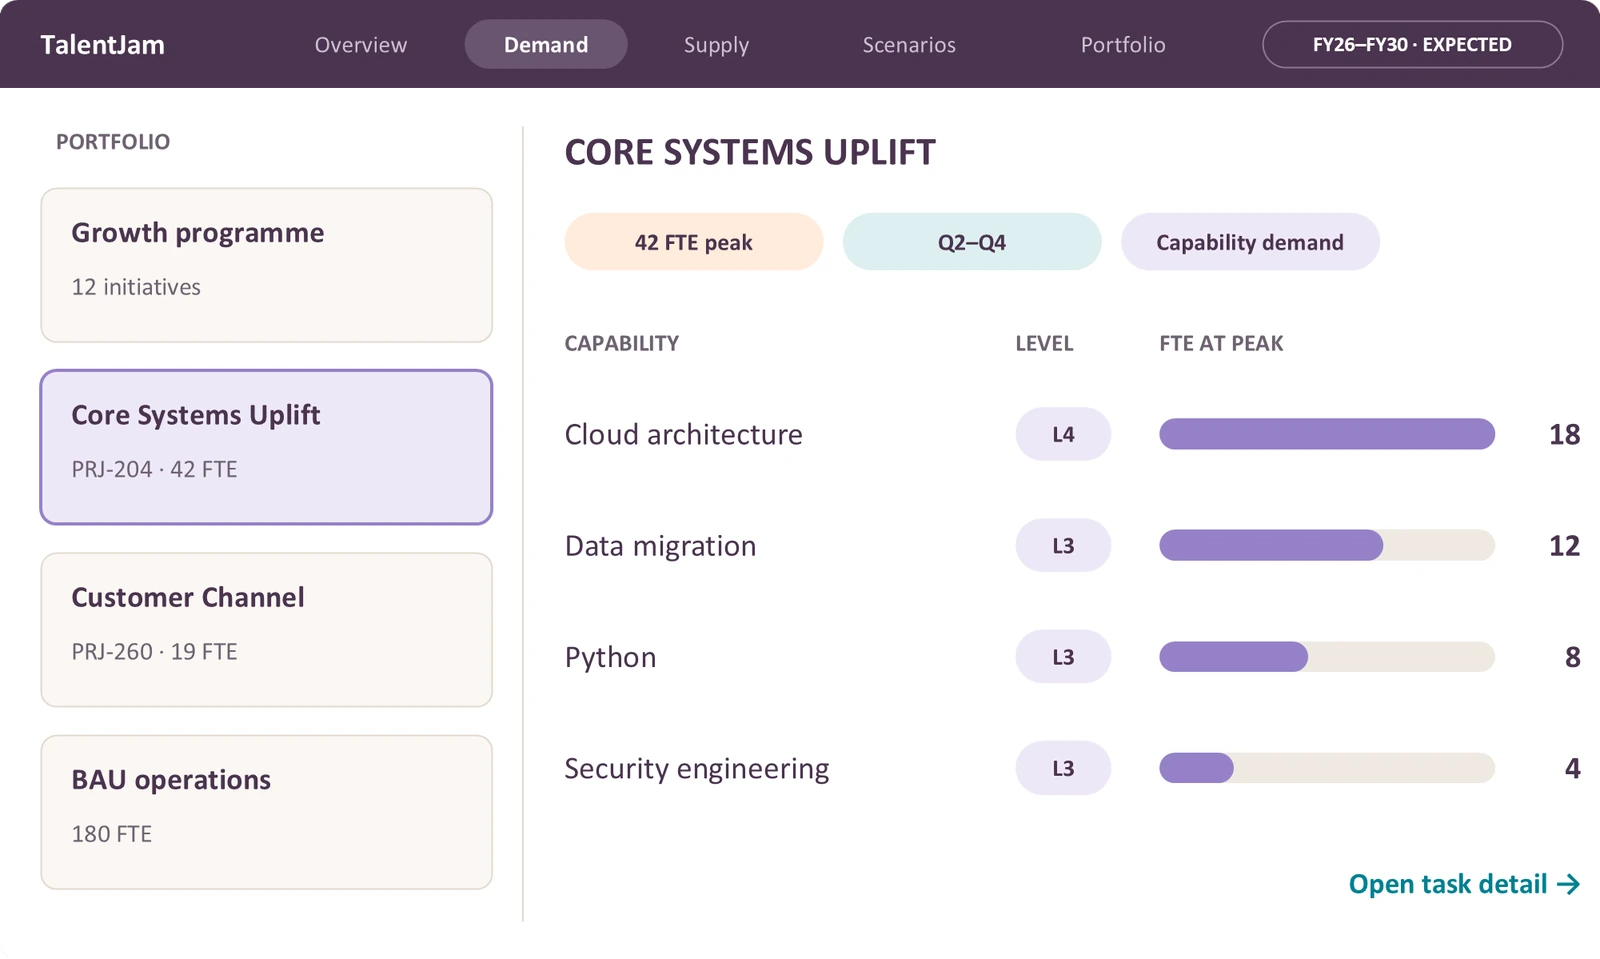
TalentJam demand view: the Core Systems Uplift project resolved into cloud architecture L4, data migration L3, Python L3 and security engineering L3, with FTE at peak

Demand: portfolio, initiative, project and task, with capability, level and volume at peak. Illustrative example.

Key principle

Don't ask the user to translate initiatives into workforce demand manually.

Selecting a project resolves its tasks into capability, level, volume and timing automatically, in the model, not in a spreadsheet. Every requirement can be traced back to the strategy that created it.

Each requirement then carries its resource options: people, AI, external supply, or a hybrid.

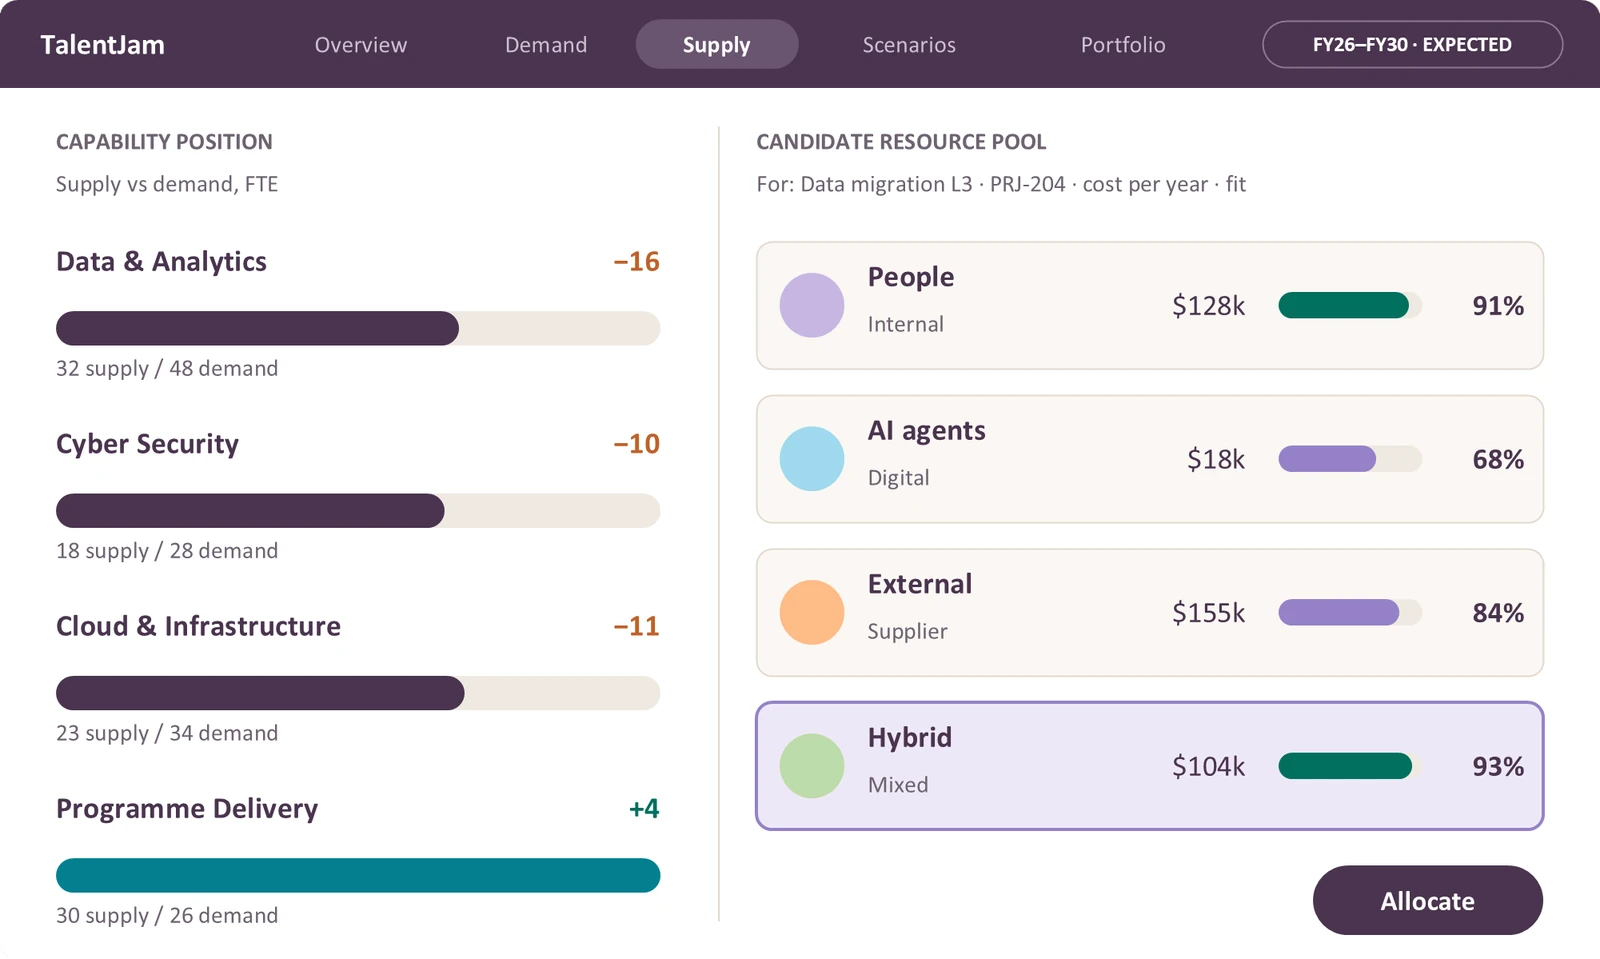
Supply isn't headcount. It is available capability, from any source.

Task- and skill-level capability data makes supply visible at the same resolution as demand, so the two can be compared directly.

TalentJam supply view: capability position by area against demand, and a candidate resource pool for data migration L3 comparing people, AI agents, external and hybrid on cost and fit

Supply: capability position against demand, and the candidate resource pool for one requirement. Illustrative example.

Supply is not a count of people in roles. It is the capability available to perform the work, wherever it comes from:

PeopleAI agentsContractorsSuppliersOther external resourcesCombinations of these

For any requirement, TalentJam assembles a candidate resource pool and compares cost and fit side by side, before anything is allocated.

Reversible decisions, cumulative consequences

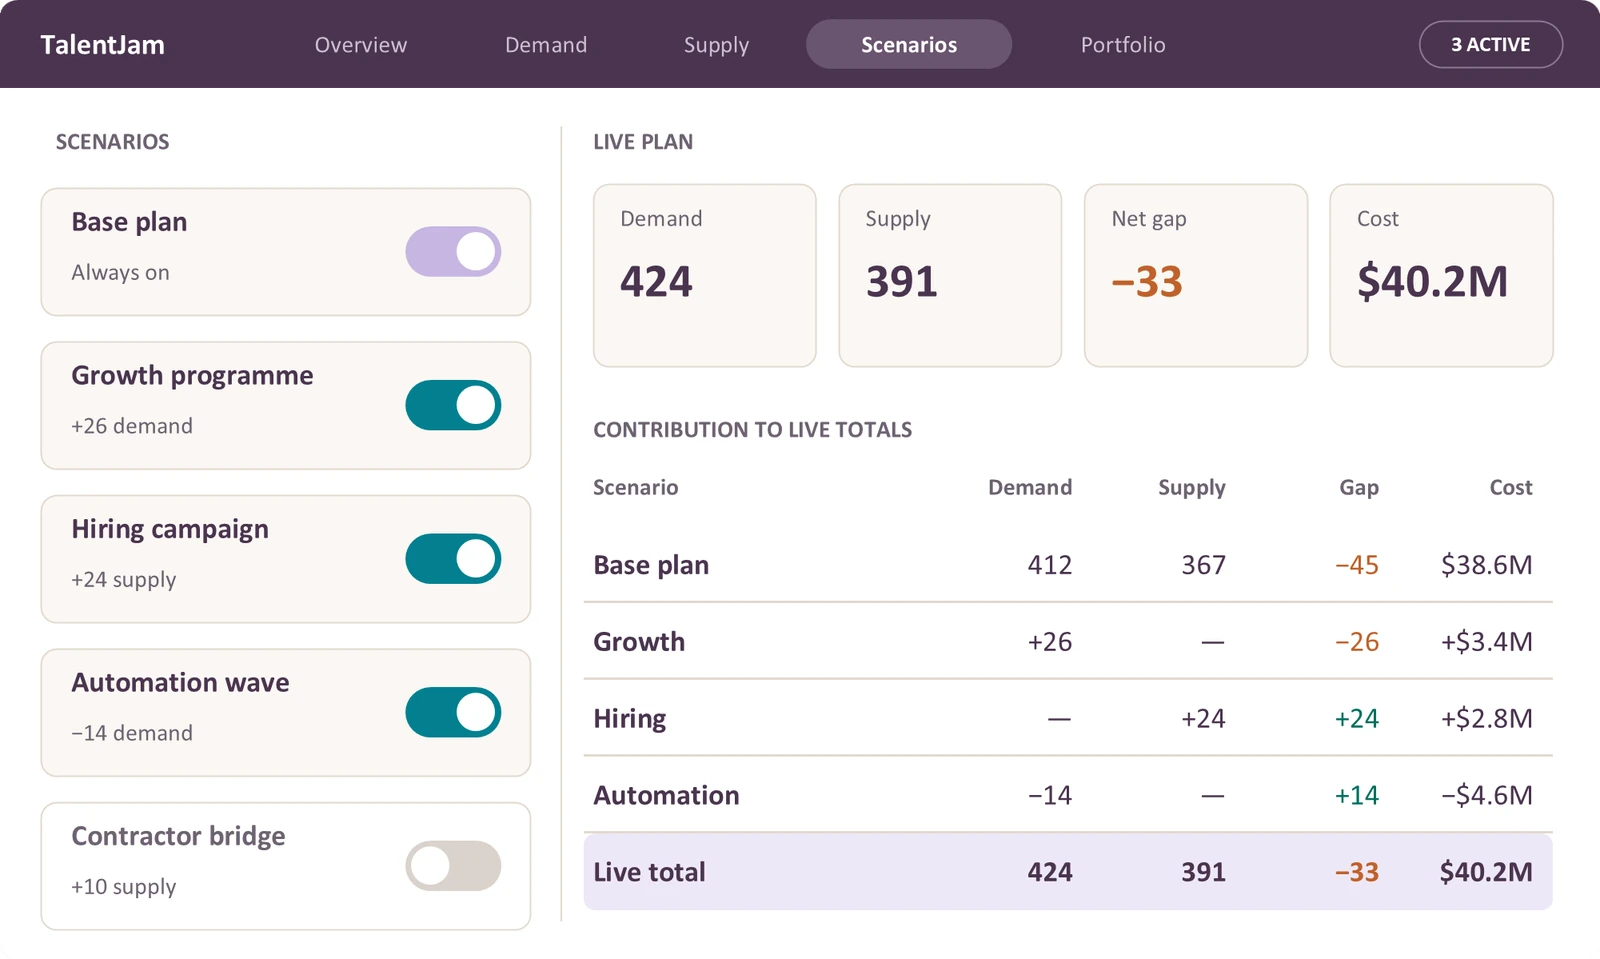
Switch scenarios on and off, see what each one contributes, and watch the live plan update.

TalentJam scenarios view: scenario toggles for growth, hiring, automation and a contractor bridge, with the live plan and each scenario's contribution to demand, supply, gap and cost

Scenarios: toggles on the left, the live plan and each scenario's contribution on the right. Illustrative example.

Every scenario carries
  • An on / off toggle
  • A description
  • Its assumptions
  • Demand contribution
  • Supply contribution
  • Cost contribution
  • Capability contribution
  • Risk and confidence contribution

And the totals update immediately.

Because each contribution is attributed, leadership can see exactly which choice moved the position, and switch it back off.

Allocate scarce capability across the whole plan

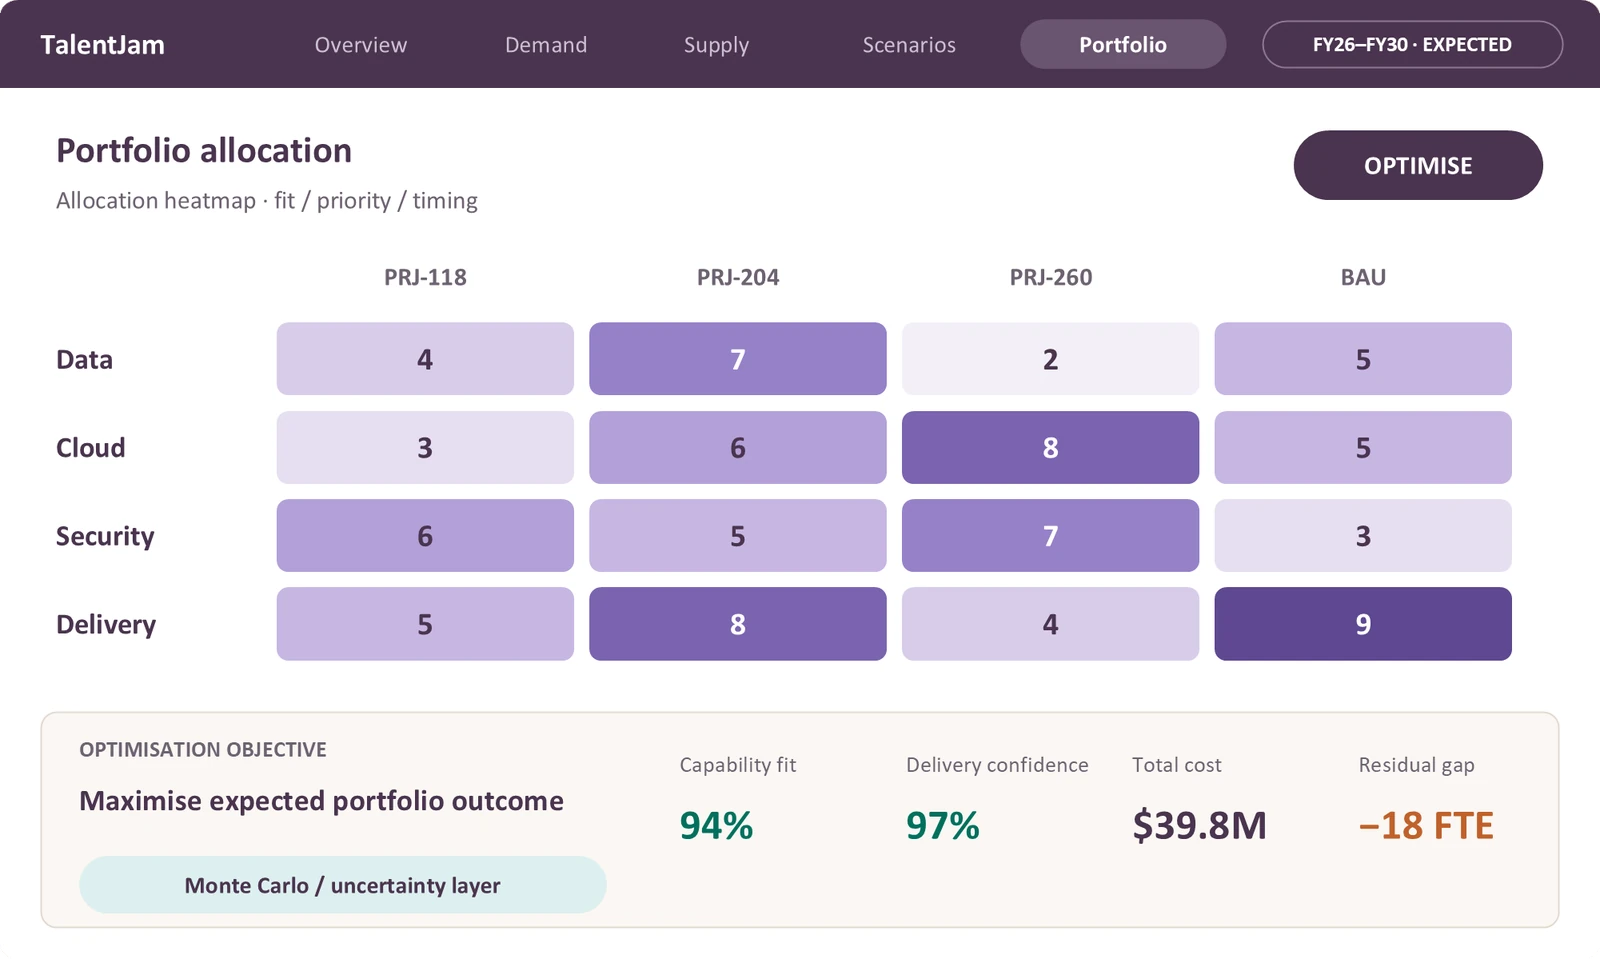
Optimise across every identified initiative, rather than solving projects in isolation. Not "Project A needs 10 people, so find 10 people for Project A".

TalentJam portfolio view: an allocation heatmap across projects and BAU, optimised for expected portfolio outcome, with capability fit, delivery confidence, total cost and residual gap

Portfolio: allocation by fit, priority and timing, optimised for expected portfolio outcome. Illustrative example.

Optimisation objective

Maximise the expected outcome of the whole portfolio.

The optimisation works across every dimension at once:

Demand×Capability×Resource×Cost×Timing×Constraints×Uncertainty

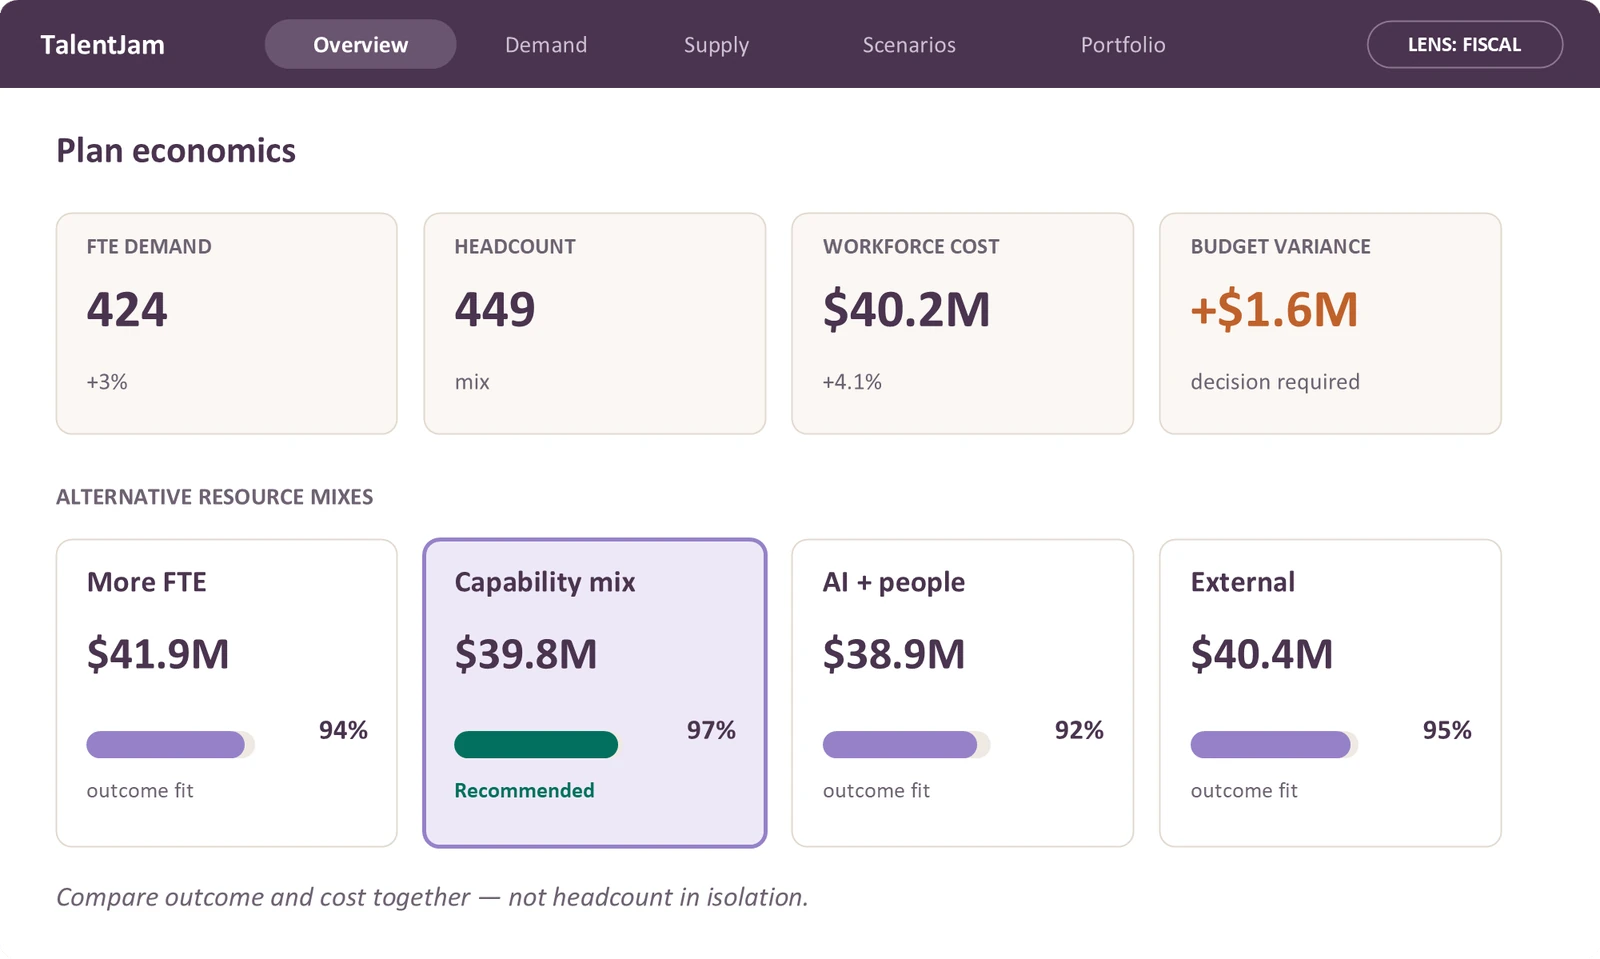
FTE, headcount and fiscal are views, not separate plans

Compare outcome and cost together, not headcount in isolation. The cheapest workforce isn't necessarily the smallest, and more people isn't necessarily more capacity.

TalentJam fiscal lens: FTE demand, headcount, workforce cost and budget variance, with alternative resource mixes compared on cost and outcome fit

The fiscal lens on the same plan, with alternative resource mixes compared on cost and outcome fit. Illustrative example.

What combination of resources delivers the required outcome at acceptable cost and risk?

Show uncertainty without hiding the decision

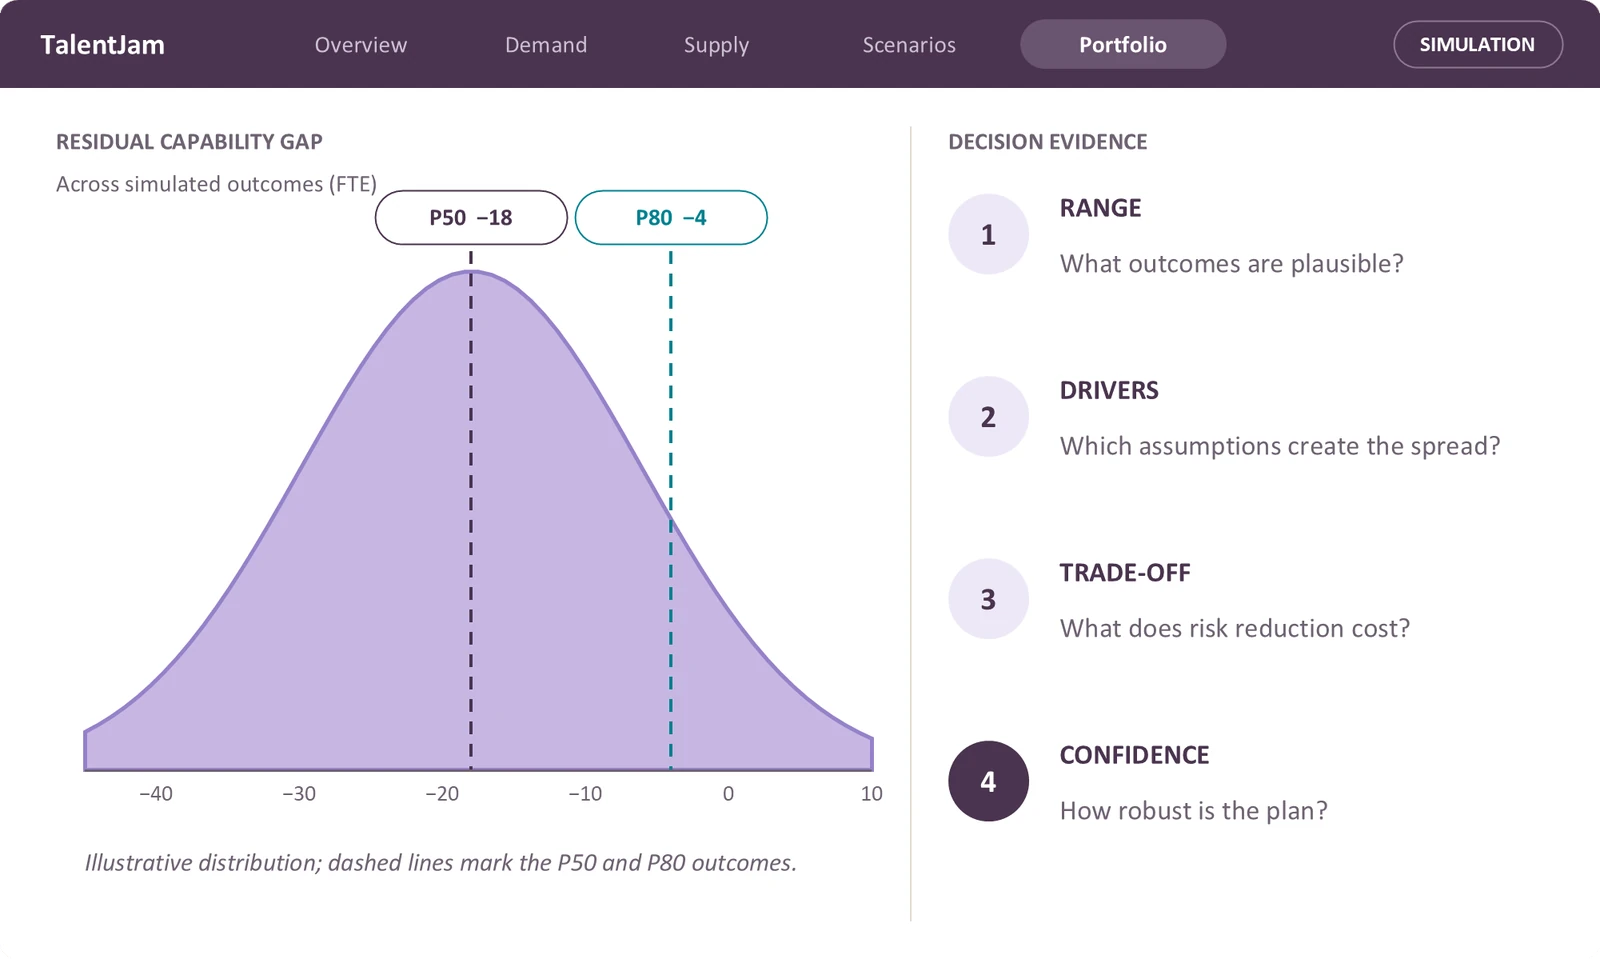
Simulation exposes the range of feasible outcomes, the drivers of spread and the cost of reducing risk. The point isn't a probability lecture. It is to answer one question: how much confidence should we have in this plan?

TalentJam simulation view: the distribution of residual capability gap across simulated outcomes, with P50 at minus 18 FTE and P80 at minus 4 FTE, beside four decision-evidence questions

Simulation: the range of residual gap across simulated outcomes, and the evidence leadership needs from it. Illustrative example.

Approval is a product state, not a meeting

Only approved scenarios become the committed plan, with an auditable trail from exploration to execution.

ExplorePosition and drivers
→
ModelBuild scenarios
→
CompareCumulative effect
→
ProposeScenario set
→
ApproveLeadership and Finance
→
CommitPublish and execute
Approval gate
  • Strategic fit
  • Budget
  • Risk
  • Delivery confidence
  • Capability sufficiency
After approval
  • Baseline the plan
  • Publish allocations
  • Track variance
  • Capture emerging demand
  • Re-plan, in a continuous planning loop

A planning loop that feels inevitable

TalentJam's demand management capability sits at the core of the workforce planning experience.

01
Strategy-linked demand
Trace every workforce requirement back to its source: strategy, OKRs, initiatives, projects, tasks and capability.
02
Scenario-first planning
Scenarios are persistent, switchable, cumulative, attributable, comparable, and reversible until approval.
03
Portfolio optimisation
Allocate scarce capability across initiatives using fit, cost, timing, priority, constraints and uncertainty.
04
Approval as a product state
An auditable decision trail from exploration, through proposal and approval, to executing the committed plan.

From strategy to execution

See what strategy requires. See what can be delivered. See what choices change the position. See what it takes to execute.

Workforce planning becomes a resource allocation problem, with the evidence to solve it.

Last updated 24 September 2026